Problem
In many villages, water meters are still read by hand. Someone goes round the village house by house, writing down each figure. Once every month or two.
That means each meter yields only a handful of figures a year. And in between, nothing. Normal use, a one-off spike or a slow leak can all end up producing the same reading. From a single figure, there’s no way of knowing what happened. And across an entire village, that uncertainty multiplies.
Remote reading changes that. Each meter sends its readings by itself, and you check them in a browser. But putting it into practice is trickier than it sounds. Every manufacturer speaks its own language. A village, with its houses spread out, can’t be connected the same way as a hotel with dozens of meters packed into a few metres. And a reading that arrives is worthless if you can’t trust it.
So the question is: how do you bring all of that together in one place and turn it into something useful for whoever manages the water?
Constraints
- A single, centralised platform. Radio in the villages, cable in the buildings, meters from different manufacturers: it all had to end up on the same platform, with the same charts and the same alerts.
- Reliable data. Each meter sends its readings in its own format. If the platform misreads it, it shows consumption that isn’t real, raising the alarm over a leak that doesn’t exist or missing a real one. Every reading is checked before it’s shown.
- Easy to use. The people using it manage the water for a local council, a hotel or an apartment block. They aren’t communications experts. Opening a browser is all it takes to see how much each meter is using and where there’s a problem.
Approach
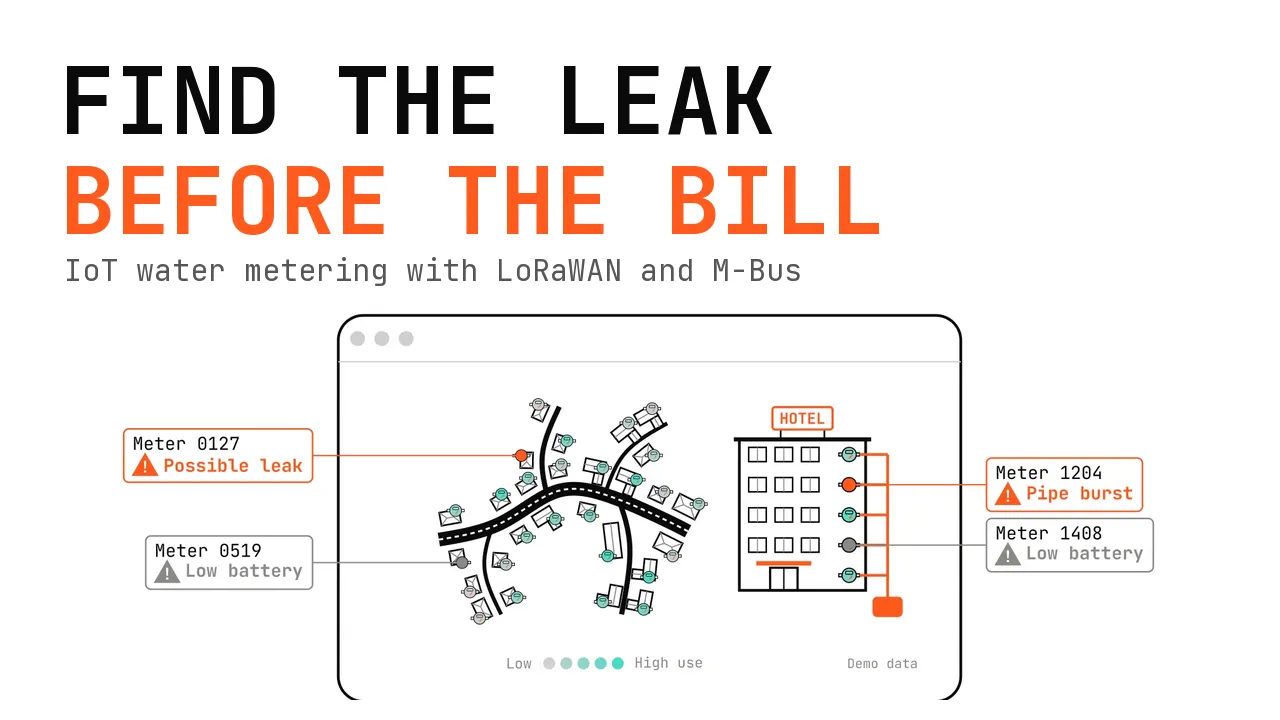
With remote meter reading, nobody has to go out and read the meter. Each one carries a small radio and sends its readings by itself throughout the day. In the browser, you can see every meter, hour by hour.
How the readings get there depends on where the meters are. In a village, the houses are spread out, so an antenna on high ground picks them up over LoRaWAN, a radio network designed to send small messages over several kilometres on very little battery. From the antenna they go to ChirpStack, the server that runs that network, and from there to the platform. In a hotel or an apartment block, the meters are close together and share a cable: M-Bus, the European standard for reading meters.
Whichever route they take, what arrives are frames, messages just a few bytes long carrying the meter’s readings. M-Bus (Meter-Bus) is a very comprehensive specification that defines both the frames and the cable they travel over. Over time, OMS (Open Metering System) has extended it with a standard layer that allows for other transports, such as LoRaWAN or NB-IoT. The latest generation of water meters for homes and infrastructure is built on it. They have no moving parts and measure using ultrasound. OMS is the common language meant to get manufacturers on the same page. In practice, each one speaks its own dialect.
My part was everything that happens once those frames reach the cloud. In three steps:
- Decoding. Translating the frames from each meter model into one common language (readings, consumption, status) and checking that everything adds up before accepting it.
- Building the backend. This is the part of the platform you don’t see. It stores every reading, works out hourly consumption and raises alerts in two ways: those sent by the meter itself, and those that come from analysing its history. It also produces reports per meter, per building or per village, on the web and as PDFs.
- Building the digital model. Every meter in its place, on the map of the village or the building. At a glance, you can see where the most water is being used and where an alert has gone off.
Result
The platform is already working with real meters from three manufacturers, each with its own format. Since March 2026 it has been receiving their readings hour by hour, and every reading is checked before it’s shown.
It’s now being rolled out. Meters are being brought onto the platform in villages in the Els Ports area of Castellón, and in hotels across the province that want to keep track of their internal consumption.
Where there used to be one figure every month or two, there’s now an hourly curve for each meter, for the whole village or building, and an alert as soon as something doesn’t add up. All in a single model of the network.
From one figure every two months to every meter, hour by hour.
Stack and deliverables
- Decoders One per meter model. They turn its frames into readings, consumption and status, and check that it all adds up.
- Backend Stores the readings, works out hourly consumption and raises the alerts.
- Digital model Every meter in its place, on the map of the village or the building.
- Reports Tailored to each need: per meter, per building or per village, on the web and as PDFs.
Where this fits
More and more equipment takes its own measurements: meters, sensors, machines. But every manufacturer speaks its own language, and the data stays locked inside the device or each brand’s software. Bringing it together takes more than knowing how to code. You need to understand the hardware, know what each device sends and how it sends it, and know when not to trust what comes in.
Making that leap is what I do: understanding each device and its protocol, bringing the data together on a single platform and turning it into something useful, whether that’s charts, alerts or a digital model. And once the data is in order, the interesting part begins. With months of history, you can train machine learning models that forecast consumption and spot anomalies before they become problems.